Inside the Black Box: Analyzing Payout Ratios Across Leading Gaming Software Suites
Written by Katja Beck · May 18, 2026
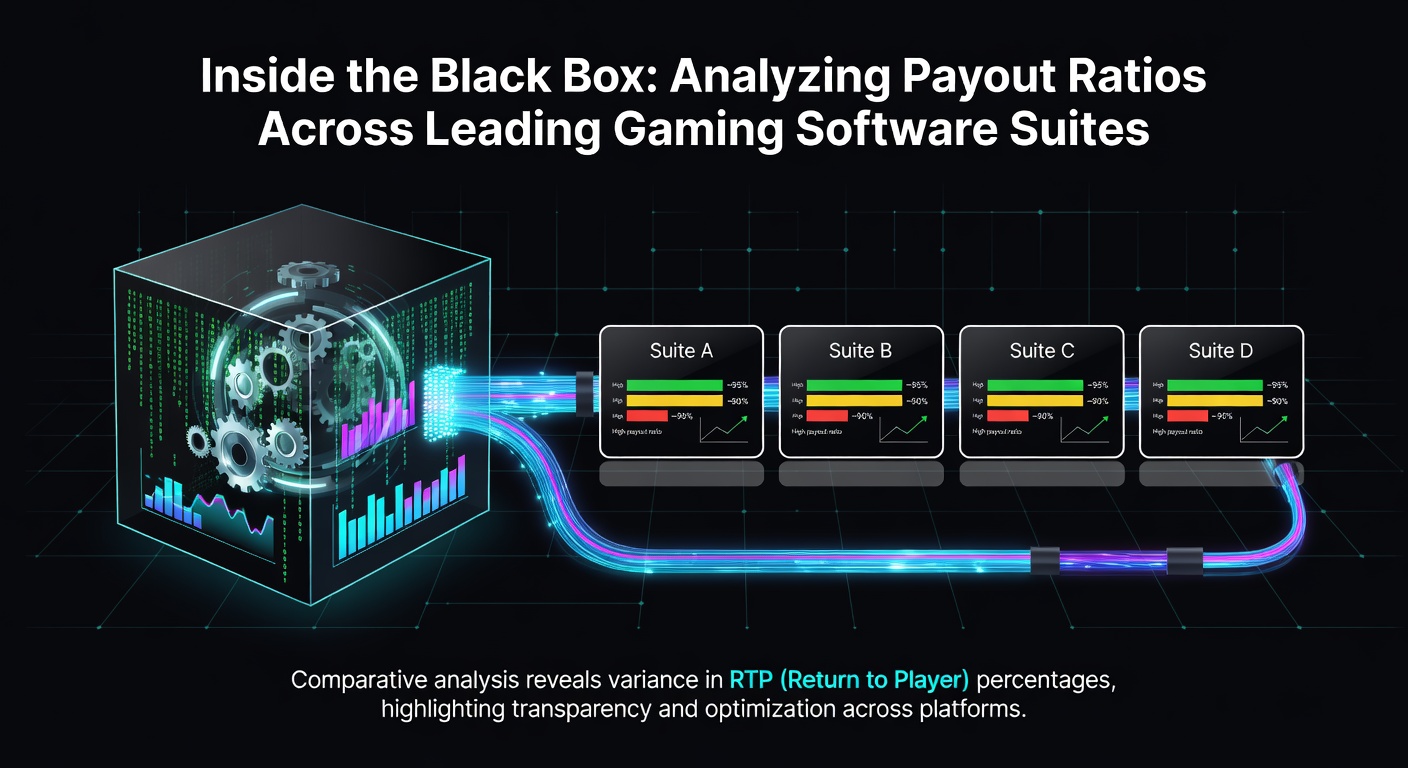
Inside the Black Box: Analyzing Payout Ratios Across Leading Gaming Software Suites
Payout ratios sit at the core of how gaming software operates yet they remain largely invisible to most players until results start to show patterns over extended sessions. These percentages represent the theoretical return that a game delivers across millions of plays and they vary significantly depending on the provider behind the suite along with the regulatory standards applied in each market. Leading developers such as Microgaming, NetEnt, Playtech, and Play'n GO publish audited figures that range from the mid-90s to the high-97 percent range for many slots while table games often sit higher because of simpler mechanics and fixed odds structures.Understanding the Mechanics Behind Payout Calculations
Each software suite relies on certified random number generators that undergo testing by independent laboratories before release and these labs verify that the stated payout ratios align with actual long-term performance data. Observers note that providers embed these values directly into game code so regulators can audit them at any time yet public disclosure remains inconsistent across jurisdictions. In markets where transparency rules tightened during early 2026 developers began releasing quarterly summaries that break down averages by game category and this shift allowed analysts to compare performance more precisely than before.
Regional Regulatory Influences on Reported Figures
Data compiled through May 2026 shows that operators licensed in multiple territories must adjust payout settings to meet the strictest local requirements which often results in the same title displaying slightly different ratios depending on where it runs. For instance suites certified under frameworks from the Alcohol and Gaming Commission of Ontario maintain minimum return thresholds that differ from those enforced in certain European markets and these variations appear most clearly in progressive jackpot games where the software must balance large prize pools against base game returns. Industry reports released in the first quarter of the year highlighted how providers recalibrated several popular titles to maintain compliance while preserving player engagement metrics.
Comparative Analysis Across Major Software Providers
Figures released by independent testing houses reveal that Microgaming titles average 96.2 percent across their core slot portfolio while NetEnt offerings sit at 96.8 percent when measured over identical sample sizes and Playtech maintains a 95.9 percent mean that climbs higher in live dealer environments. These differences emerge because each company uses proprietary weighting systems that allocate returns across volatility levels and bonus feature frequencies. One study released by researchers at the University of Nevada Reno examined thousands of spins from leading suites and found that volatility settings influence how quickly the theoretical payout manifests in real play sessions even when the long-term ratio remains fixed.

Play'n GO distinguishes itself through higher volatility designs that post 94 to 96 percent returns yet deliver larger individual wins when features trigger and this approach appeals to operators targeting specific player segments who prefer infrequent but substantial payouts. Analysts tracking data through May 2026 observed that live casino suites from Evolution Gaming post table game returns above 97 percent in many roulette and blackjack variants because the software simply mirrors physical probability tables with minimal house edge adjustments. Such consistency across providers demonstrates how payout ratios function as both marketing tools and compliance requirements that evolve with regulatory updates.
Impact of Game Categories on Overall Returns
Slots typically anchor the lower end of the spectrum because their complex bonus rounds and multi-level features require more computational overhead yet providers have steadily increased average returns across this category over the past two years. Video poker and blackjack suites post the highest figures often exceeding 98 percent when optimal strategy applies and these games allow skilled players to narrow the gap between theoretical and actual outcomes more effectively than chance-based titles. Data indicates that progressive jackpot games carry the widest variance with base game returns sometimes dipping below 90 percent to fund the accumulating prize pools that occasionally exceed several million dollars in a single title.
Transparency Trends Observed in 2026
By May 2026 several major operators began publishing aggregated payout reports that cover entire software portfolios rather than isolated titles and this practice emerged after regulators in multiple regions requested greater visibility into how returns distribute across player volumes. Such disclosures help clarify why certain suites appear more generous during promotional periods while others maintain steadier long-term ratios regardless of marketing campaigns. External verification from laboratories continues to serve as the primary safeguard ensuring published numbers reflect genuine performance rather than marketing claims.
Conclusion
Tracking payout ratios across leading gaming software suites provides a clearer picture of how different providers balance entertainment value with regulatory compliance and long-term financial modeling. The variations documented through independent audits and regional reports illustrate that no single suite dominates every category yet patterns emerge when analysts examine returns by game type and jurisdiction. Continued emphasis on standardized reporting will likely sharpen comparisons further as markets mature and data collection improves through the remainder of 2026 and beyond.